Movie Industry Python Analysis
This project was written in python3 using Jupyter Notebooks. This project's purpose was to manipulate a large data set using python. I used libraries numpy,
seaborn, and pandas to analyze the data. The data set I used contains many different movies throughout the year from 1986 to 2020. It includes its data like
budget, gross, released date, etc. With this large amount of data, I could easily manipulate the data and create some conclusions from it to create a
correlation.
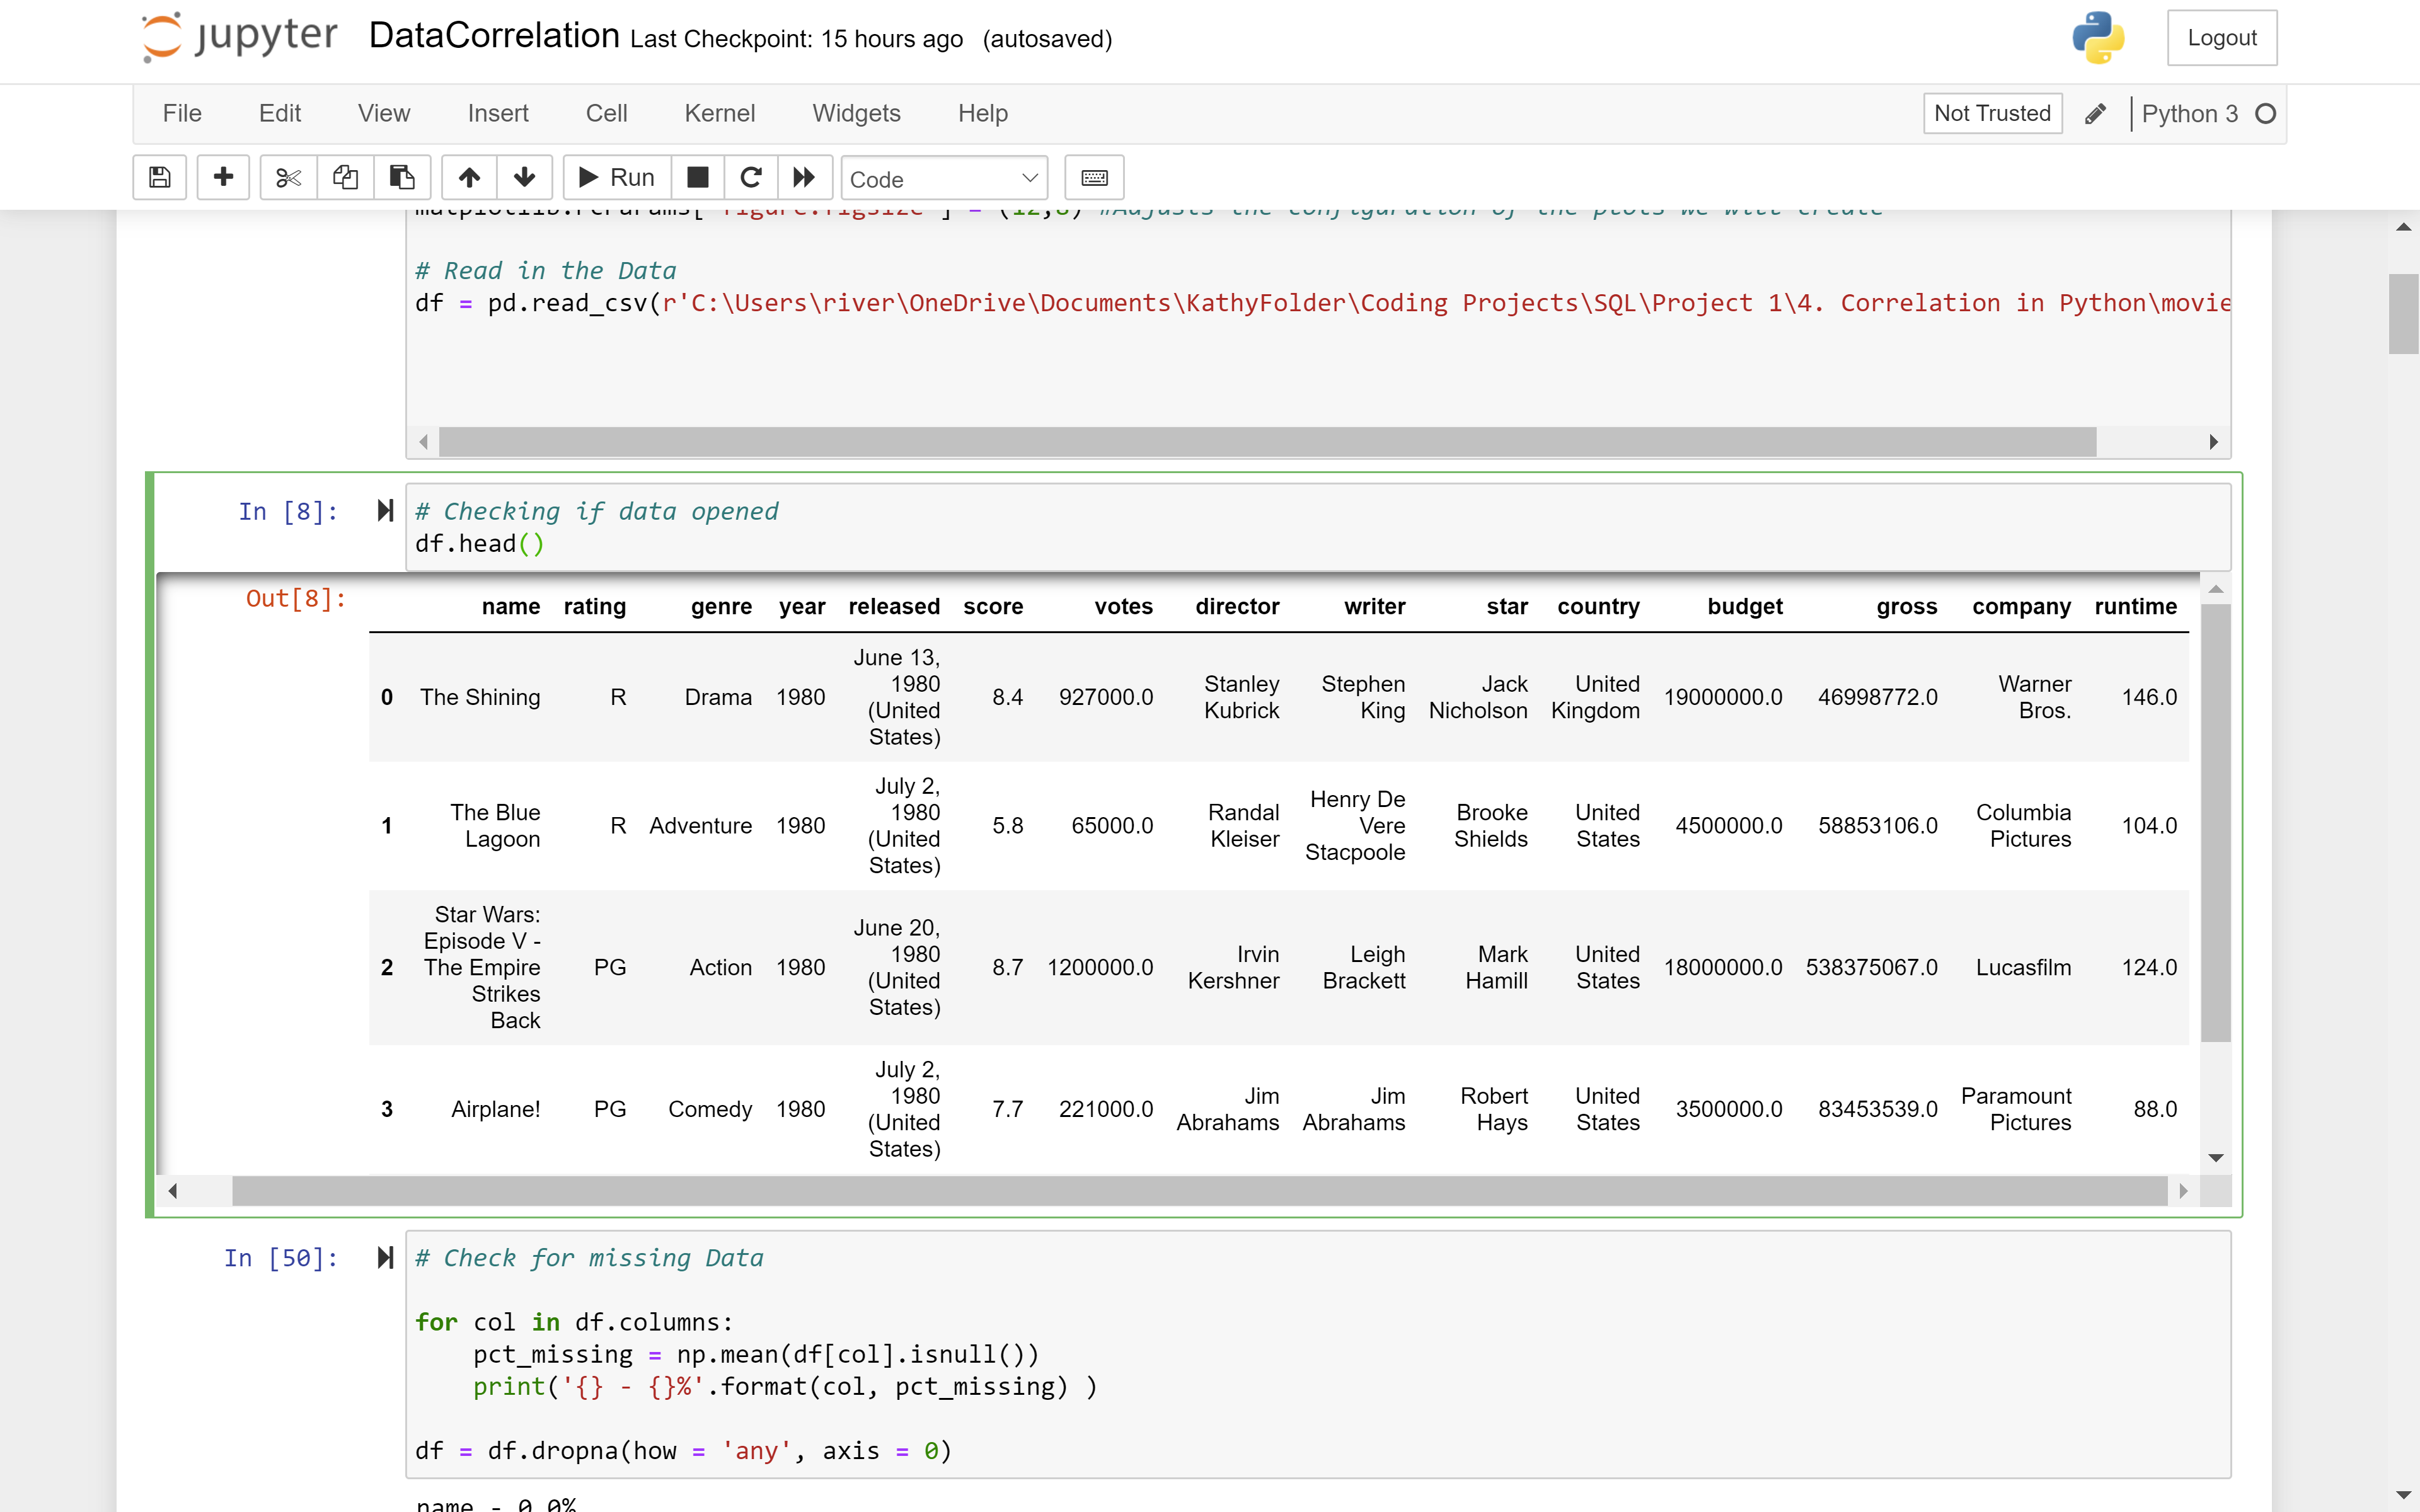
First, I organized the data set to make it a little bit easier to manipulate and use matrices and plots. This included making the release year more accurate
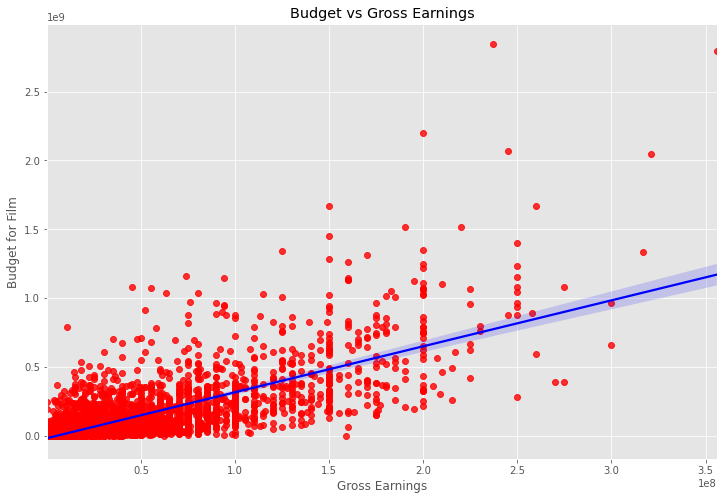
and changing some data types in some columns. Then I created a scatter plot using matplot to compare the correlation between budget and gross. This showed that
there was some positive correlation. Also I created a regression plot using the seaborn to create a regression line based on the data and show the positive
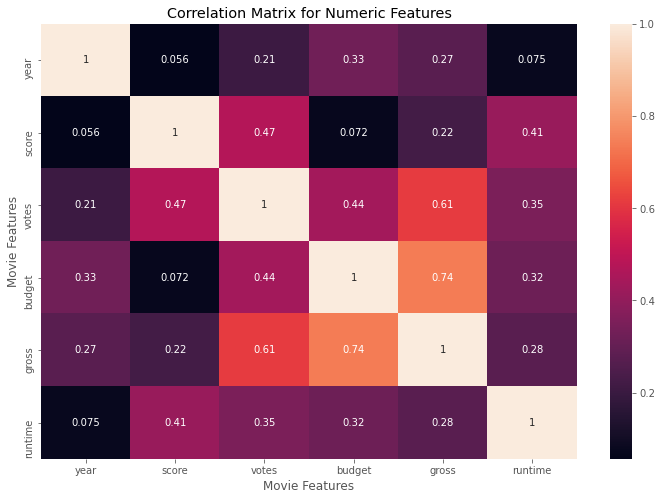
correlation more clearly. Next, I created a matrix that would take all the columns that contained a numerical value, and compare them to each other to
observe the highest correlation. The correlation method used was Pearson, although there were other methods I could have used like Kendall and Spearman. Then
to make the matrix more pleasing, I used a heatmap to provide a nice visual. By this visual, it could clearly be seen that gross and budget had a high correlation
as well. Something that surprisingly had a correlation was votes and gross.This process of using python to analyze data sets taught me that there are other ways to
show correlation besides a scatter plot.
This code can be found on my github and the data set I used as well.
https://github.com/kathyrivera9/Movie-Industry-Analysis